
What is a Good HRV: Heart Rate Variability Chart by Age
A higher heart rate variability doesn’t necessarily mean it is better.


HRV stands for heart rate variability and reflects variations between heartbeats. While it’s generally considered that higher HRV indicates better health, this is not entirely accurate. As with many aspects of life, it’s more about the dynamics than just the numbers. Allow me to explain.
First of all, I’ve been researching this topic for over a decade, since I developed the EightOS bodymind operating system and began my research in nonlinear dynamics at Nodus Labs. What I consistently found is that we can’t apply simplified binary metrics to natural processes. Our body is a complex system with many interacting parts, so it’s essential to consider the dynamics of change rather than just the numbers. Higher heart rate variability generally suggests greater nervous system flexibility, resilience, and an improved ability to respond to and recover from stress.
However, that's not the whole story. The dynamics of that variability are equally crucial. Research indicates that when this dynamics display fractal properties, they are associated with a lower mortality risk, increased adaptability and endurance, and even enhanced psychological well-being.
Let’s explore how it works in detail, starting from the basics and then getting into the fractal realm.
Try the SomaSync HRV Entrainer app to measure and improve your HRV.
HRV Chart by Age: RMSSD vs SDNN
Conventional wisdom suggests that higher heart rate variability indicates better vascular health. The older you are, the lower your HRV is, so the conventional HRV chart by age looks like this:

If you are 40 years old, your optimal HRV should be at 30-60 ms when measured using the RMSSD method at the state of rest (used in most fitness trackers like Oura and most HRV tracking apps) or 35-50 ms when measured using the SDNN (used by continuous trackers like Apple Watch). In simple terms, this means that each time your heart beats, there's a variation in milliseconds between the beats, known as RR intervals.

How does it work? If your heart beats at 60 beats per minute, you won't have exactly 1000 ms between each beat. Instead, the RR intervals might be 982, 1021, 1009, 989, and so on. This happens mainly because when you inhale, your parasympathetic vagal activity (responsible for rest and recovery) is withdrawn, so the heart speeds up. When you exhale, your parasympathetic vagal activity is restored, so the heart slows down.
High variability indicates that your vagal brake is strong and responsive — you can shift gears quickly, responding to stress when needed but also recovering efficiently.
The 30 to 60 ms RMSSD range means that when you measure how much each beat differs from the next you get 30-60 ms. RMSSD (Root Mean Square of Successive Differences) is focused on the differences between the consecutive beats, so it is a cleaner marker of parasympathetic system’s activity.
The SDNN (Standard Deviation of Normal-to-Normal intervals) measures the total spread of all your beat intervals around the average, so the 40 to 80 ms healthy SDNN range captures the changes from all sources — parasympathetic, sympathetic (response to stress), circadian rhythms, and activities. That is also why SDNN will generally be slightly higher than RMSSD.
The younger and healthier you are, the more responsive your body is to parasympathetic activity, leading to higher HRV. It will also be higher when you are resting or sleeping. While the standard range for a 40-year old male is 30 to 60 ms, it could easily double during sleep, prolonged rest, or as a result of regular, but not excessively straining, physical activity. As you get older (or sicker), your HRV decreases, so for a 65+ year old person this difference decreases to 15-35 ms RMSSD and 25-50 ms SDNN. So what does it tell us about your health?
What is a Dangerously Low HRV?
Low HRV means that your heart cannot vary its rhythm so well. In simple terms, it is stuck in one gear and is unable to adapt to changing demands. Low HRV predicts higher risk for cardiac events, chronic disease, and earlier mortality.
Technically, low HRV suggests a reduced parasympathetic (rest-and-digest) tone and often a dominance of the sympathetic system (fight-or-flight response). This means the body remains in a stress-response state, with a diminished ability for rest, repair, and inflammatory regulation, which can eventually damage cardiovascular tissue and disrupt metabolic and immune functions.
Since each body is unique, determining dangerous low HRV levels is best done by observing trends rather than focusing on absolute numbers. However, as a general rule:
RMSSD: below 15-20 ms is concerning for most adults. Under 10 ms is red flag.
SNDD: below 50 ms on a 24-hour recording may be linked with increased cardiac risk.
A drop of 50% or more from your personal baseline in a single day is concerning.
A drop of 30% or more during 3-7 days indicates that the body is under significant strain, so this should be investigated.
A drop of 30% or more for months may require medical attention.
An HRV that is flatlining and losing all variability can precede cardiac events.
HRV Dynamics: the Fractal Component
Now we come to the most interesting part: the dynamics of heart rate variability. As mentioned earlier, it is well established that the fractal dynamics of HRV are associated with greater adaptability and resilience and can also be used to enhance training outcomes. Biological systems operate at the edge between order and chaos. What do the fractal dynamics look like?
HRV fractality is usually measured using the so-called DFA (Detrended Fluctuation Analysis), which produces so-called alpha component indicating the level of correlation across different scales. When alpha1 ≈ 1.0 the system is fractal (in temporal sense).
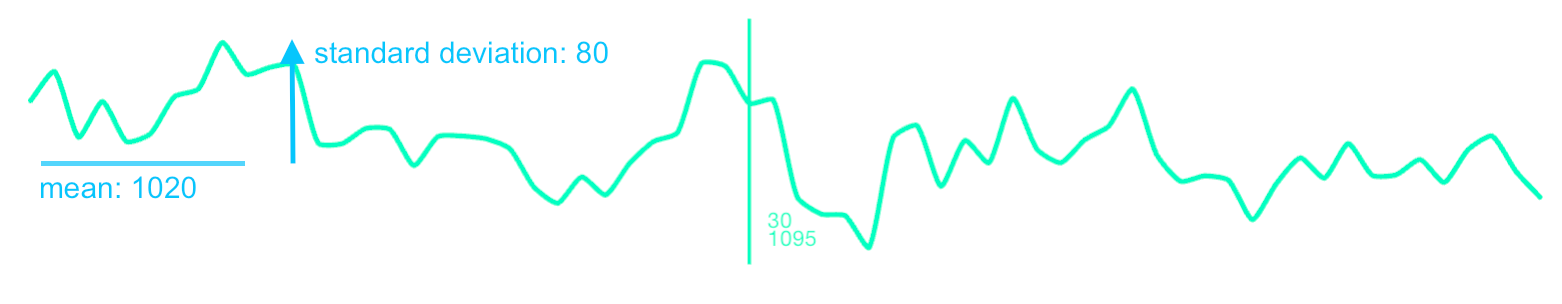
To illustrate what this means in practice, here is a graph of the heart beat intervals that are not fractal, but follow so-called brownian motion (with alpha1 component around 1.4). That is most common in everyday life or also during the periods of emotional or physical stress. The system drifts and gets stuck in a certain state — it can't break out of a trajectory to respond to new demands.

Another extreme is when the dynamic is random (white noise) with alpha1 component around 0.5. This means that there is no coordination across timescales. The system doesn’t have memory and can’t maintain coherent function. This dynamics is usually shown during recovery or when an athlete crosses the anaerobic threshold:

Finally, when alpha1 is close to 1, the system has memory across different timescales. What happens beat-to-beat is connected to what happens over seconds, which connects to minutes. The system can change states but it’s not locked in a single one and can respond and adapt to perturbations across scales:
Why is the optimal HRV variability fractal in nature? The heart is regulated by overlapping feedback loops: vagal (beat-to-beat), baroreceptors (seconds), thermoregulation (minutes), hormonal/circadian (hours). When these loops are healthy and well-coordinated, their interaction produces fractal scaling naturally. When one breaks down — disease, chronic stress, overtraining — you lose that multi-scale coordination and α1 drifts toward rigidity or randomness.
When we optimize HRV for the maximum RMSSD value, we focus too much on the vagal (parasympathetic) aspect. Yes, it indicates that the body is at rest, but it is not very useful as a measure of resilience and adaptability. for everyday life or fitness activities where it will naturally decrease and become affected by other factors. When we optimize for the maximum SDNN value, we may inadvertently give too much importance to the changes that happen due to external influences (change of activity, longer feedback loops), but that won’t give us any information about the system’s resilience and adaptability.
That's why DFA is such a useful measure: it captures how variability at short timescales relates to variability at longer timescales. When DFA α1 is fractal (around 1.0), it indicates that the beat-to-beat fluctuations driven by parasympathetic activity follow the same statistical scaling pattern as longer-term variations. This is a signature of healthy complexity — the regulatory systems operating at different timescales (vagal, baroreceptor, hormonal) are well-coordinated with each other. The system isn't stuck in rigid patterns or drifting randomly, but maintains adaptive flexibility across scales.
To measure your HRV and DFA alpha1 fractality with an Apple Watch or Polar H10 tracking device, you can use the SomaSync HRV Entrainer app that I developed.